
Introducing Zoho Analytics 6.0 Beta
Elevate Your Data Analytics Experience
We’ve just heard Zoho have unveiled Zoho Analytics 6.0 Beta, the latest major version packed with innovative features catering to a diverse range of users—from business professionals to data scientists. Developed with meticulous attention to current and future business needs, this update takes the exisitng Zoho Analytics and integrates valuable user and market feedback to deliver unparalleled functionality and usability.
Note: Zoho Analytics 6.0 Beta will be available in all Zoho Analytics paid plans from 19 June 2024. Features available in specific plans are annotated inline. The beta version is not available in the bundle plans like Zoho One and CRM Plus. Zoho are working to support the 6.0 version for all plans during general availability release.
1. Data Connectors and Data Management
Zoho Analytics now offers an expanded library of over 525 data connectors, including 25+ new connectors for big data platforms and business applications such as Yellowbricks, ClickHouse, Dremio, Zoho Connect, Zoho Marketing Automation, Zoho Backstage, Amazon Seller Central, Airtable and many more…
Managing data is now more efficient with new capabilities like Audit History, Sync History, and Import Rollback. These features ensure data integrity, enhance security, and streamline data synchronisation processes across all data sources within Zoho Analytics.
Audit History – Enhancing Security and Accountability
Audit logs play a pivotal role in maintaining robust security measures and addressing operational challenges effectively. They serve as a detailed record of all user and system actions within Zoho Analytics, capturing crucial information such as timestamps and administrator details for every performed action.
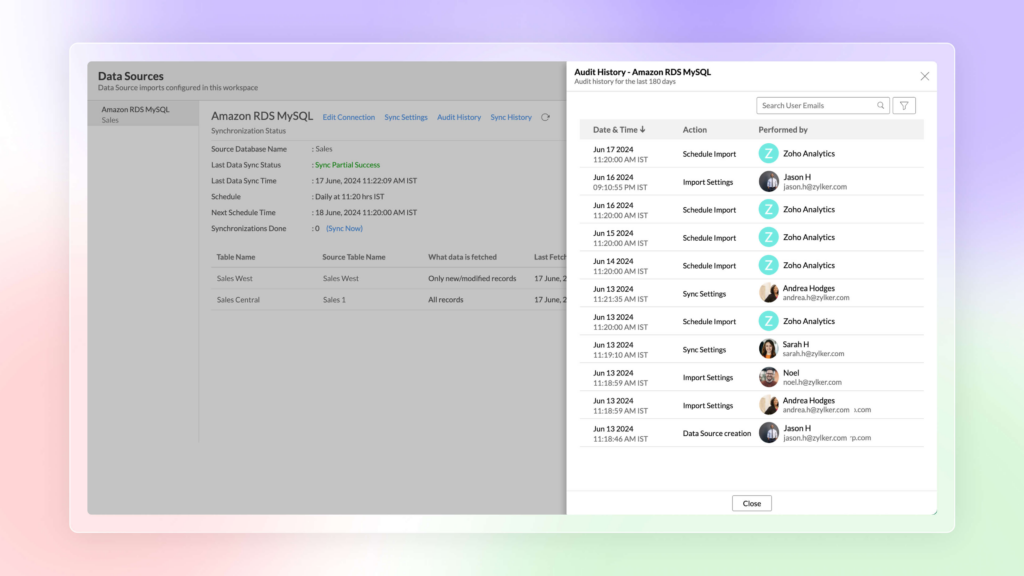
Business benefits of updated Audit History
This comprehensive visibility ensures transparency, facilitates troubleshooting, and enables swift resolution of any issues that may arise. By leveraging Audit History, organisations can uphold stringent security protocols and uphold accountability across their data analytics operations, safeguarding sensitive information and maintaining regulatory compliance seamlessly.
Sync History – Enhanced Data Synchronisation Monitoring
Sync History in Zoho Analytics 6.0 Beta offers administrators a comprehensive view of data synchronisation activities, empowering them with detailed insights into the status of each synchronisation process.

Business benefits of the improved Sync History
This feature simplifies tracking by employing colour-coded indicators: successful sync operations are highlighted in green, while failures are flagged in red, accompanied by specific reasons for the failure and actionable recommendations. By providing real-time visibility into synchronisation outcomes, Sync History ensures proactive management of data integration processes, minimising disruptions and optimising data reliability across organisational workflows.
Import Rollback – Ensuring Data Integrity
In Zoho Analytics 6.0 Beta, Zoho introduce Import Rollback, a powerful feature designed to maintain data integrity amidst automated data imports. Automated imports, while efficient, can occasionally introduce errors or inconsistencies that impact data quality and analysis outcomes. Import Rollback addresses these challenges by enabling users to revert to the previous data import version seamlessly.
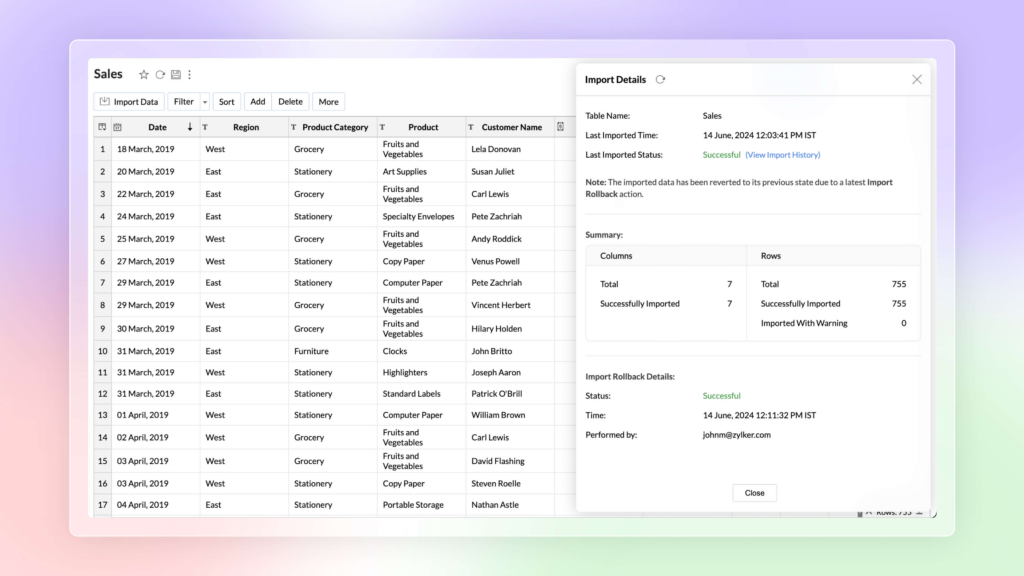
Business benefits of the new Import Rollback
This capability ensures that any discrepancies or issues encountered during the current import process are promptly rectified without disrupting ongoing data flows or analytical insights. By safeguarding against data inconsistencies, Import Rollback empowers organisations to uphold high standards of data integrity and reliability in their decision-making processes.
Unified Metrics – Standardising Data Analysis
In Zoho Analytics 6.0 Beta, Zoho have introduced Unified Metrics, a feature designed to streamline data analysis across workspaces. With data often sourced from diverse origins, each table or data source may compute different metrics or aggregates for analysis. Unified Metrics consolidates all these metrics across the workspace, promoting standardisation and eliminating duplication.
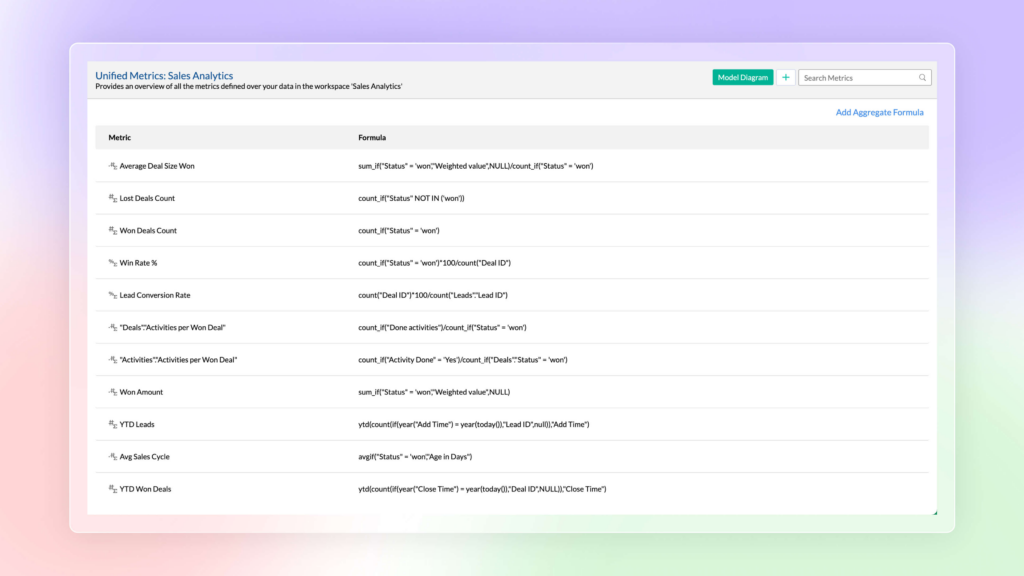
Business benefits of Unified Metrics
By centralising metrics, organisations can ensure consistency in data interpretation, enhance collaboration among teams, and optimise resource utilisation. This feature not only simplifies the analysis process but also fosters a cohesive analytical environment where stakeholders can confidently derive actionable insights from unified and standardised data metrics.
Data Bucketing – Simplifying Data Categorisation
In Zoho Analytics 6.0 Beta, Zoho introduce Data Bucketing, a powerful feature that simplifies data categorisation and analysis. Previously, users had to write complex formulas to categorise or group data points. Now, with Data Bucketing, this process is streamlined with an intuitive, built-in option.
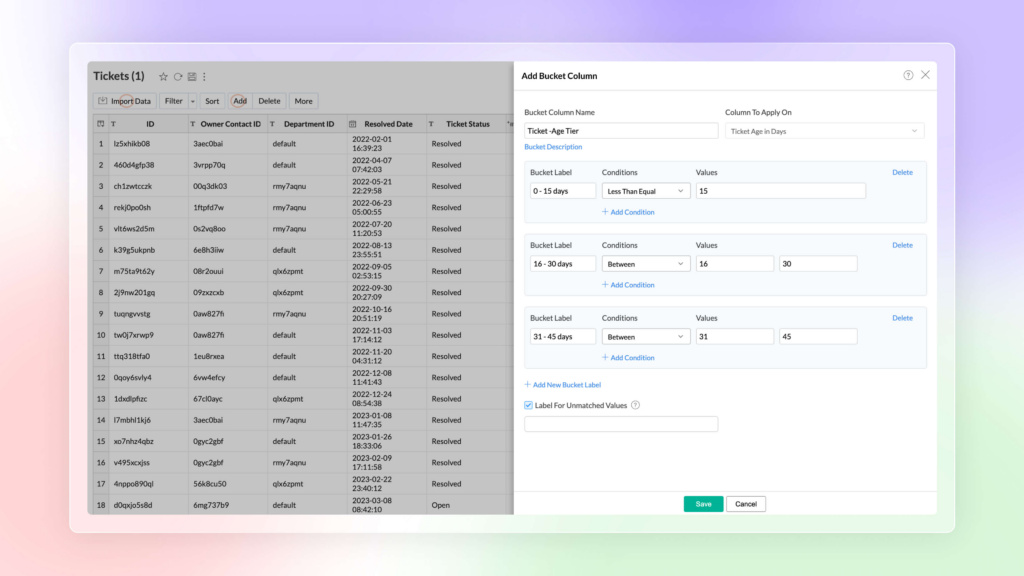
Business benefits of Data Bucketing
Data Bucketing allows users to transform numerical data into categorical bins effortlessly, reducing the number of distinct values (cardinality). This capability not only enhances the efficiency of data analysis but also improves data visualisation and interpretation. By enabling users to easily group data into meaningful categories, Zoho Analytics empowers organisations to derive deeper insights and make informed decisions swiftly.
2. New Visualisations
Expand your data visualisation capabilities with over 55 chart types, including new additions like Sankey Charts, Racing Charts, and Sunburst Charts. These visualisations provide deeper insights into data flows, time-based trends, hierarchical structures, and conversion processes, empowering users to communicate complex data stories effectively.
Types available include:
Sankey Chart: Ideal for visualising process flows, Sankey charts vividly capture data movement from one point to another through interconnected lines, facilitating a clear understanding of event progression and relationships.
Racing Chart: Animated and dynamic, Racing charts are designed to visualise changes in data over time, emphasising the relative ranking of categories. They provide a compelling visual narrative of data fluctuations and progression, enhancing user engagement and storytelling capabilities.
Sparkline: Compact yet powerful, Sparklines are perfect for displaying trends and variations in data without occupying much space. Supported variations include line charts, area charts, and bar charts, seamlessly integrating with pivot tables for quick metric comparison across different fields.
Geo Map Layering: Enhance data exploration with Geo Map Layering, allowing users to overlay multiple data layers on geographical maps. Interactive features facilitate comprehensive visualisation of various dimensions of information, empowering deeper insights.
Sunburst Chart: Represent hierarchical data structures through concentric circles, where each ring denotes a level in the hierarchy. This intuitive visualisation method helps users navigate from the root node to leaf nodes, with the size of each arc proportional to data values, aiding in hierarchical data analysis.
Conversion Bar Chart: Visualize stages of processes with Conversion Bar Charts, illustrating gradual data decrease across different stages. Each stage is represented by a bar, featuring a step or staircase pattern that indicates value shifts and conversion percentages at each stage.
Tree Map: Use differently-sized rectangles in Tree Maps to represent data values, ideal for illustrating part-to-whole relationships among various categories. This visualisation method provides a clear and intuitive overview of data distribution and proportions.
These new chart types and visualisation enhancements in Zoho Analytics 6.0 Beta are designed to empower users with enhanced data storytelling capabilities, deeper insights, and more informed decision-making processes.
Zia Suggestions
With the introduction of Zia Suggestions in Zoho Analytics 6.0 Beta, we’ve revolutionised the data visualisation experience. Zia now offers intuitive and tailored chart recommendations right in the midst of your report creation process. Seamlessly integrated, Zia Suggestions analyse your data and propose a variety of chart options that best fit your dataset’s characteristics.
Business benefits of using Zia Suggestions
These intelligent suggestions not only streamline the chart selection process but also empower users to preview and apply recommended charts effortlessly with just a click. By eliminating the guesswork involved in chart selection, Zia Suggestions enhance productivity, accelerate insights generation, and ensure that your data is presented in the most impactful and insightful manner possible.
3. Advanced Data Analytics
Zoho Analytics introduces Anomaly Detection and Cluster Analysis (Enterprise Plan), enabling diagnostic and predictive analysis. Detect outliers early, identify patterns, and segment data to uncover actionable insights that drive strategic decision-making. Set alerts based on thresholds and anomalies to ensure timely response to critical business metrics.
Anomaly Detection (Zoho Analytics Enterprise Plan)
Anomaly Detection in Zoho Analytics, available through the Enterprise Plan, enhances diagnostic analysis by identifying outliers and unusual patterns in your data. This capability serves as an early warning system, enabling executives and analysts to proactively identify potential issues, capitalise on successful strategies, and understand external factors influencing performance.
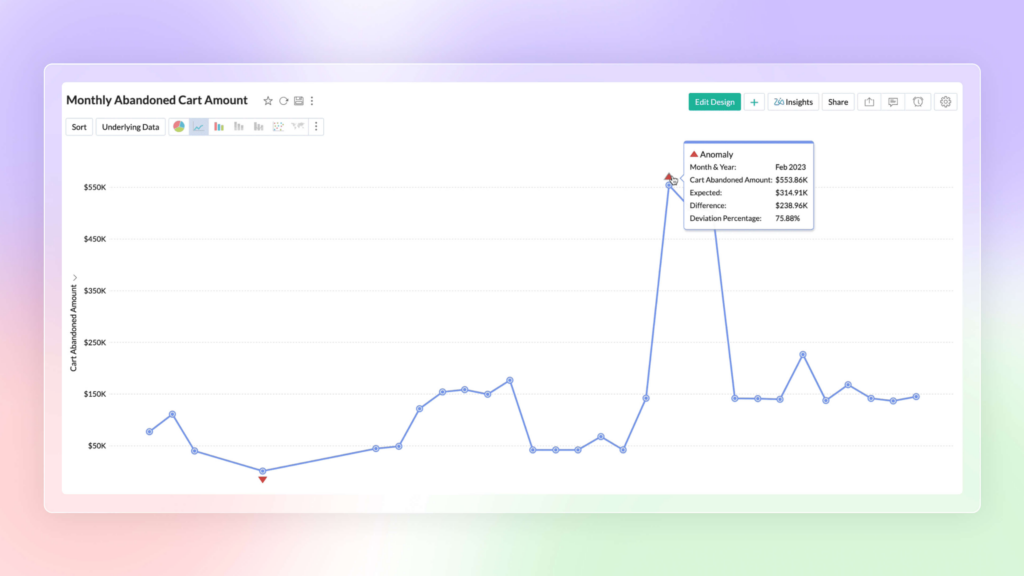
Business benefits of using Anomaly Detection
Utilising robust machine learning algorithms and statistical models, Zoho Analytics analyses the distribution of your data to detect anomalies effectively. By pinpointing outliers that deviate significantly from the norm, this feature empowers organisations to take swift and informed actions, ensuring data integrity and optimising decision-making processes.
Cluster Analysis (Zoho Analytics Enterprise Plan)
Cluster Analysis in Zoho Analytics, available through the Enterprise Plan, facilitates data segmentation by grouping similar data points based on specified numerical or categorical factors. This analytical method reduces data complexity by organising data points into clusters where each cluster comprises data points that exhibit greater similarity to each other compared to those in other clusters.
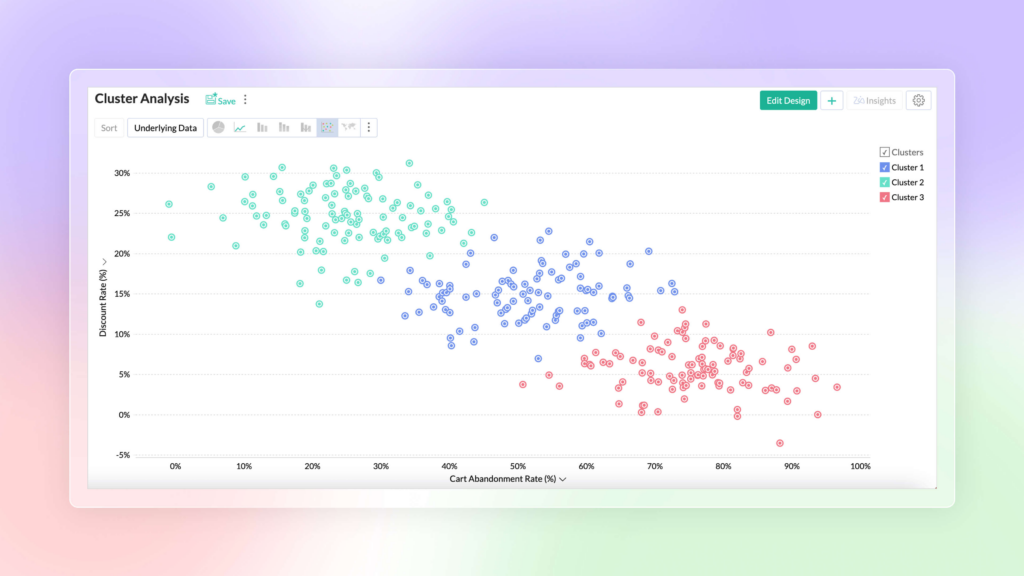
Business benefits of using Cluster Analysis
By leveraging cluster analysis, organisations can uncover meaningful patterns and insights within their data, enabling them to make informed decisions and strategic adjustments. Whether grouping customers based on purchasing behaviour, segmenting market data by demographic factors, or clustering products based on sales performance, Zoho Analytics empowers users to explore data relationships and derive actionable insights that drive business growth and efficiency.
Alerts Based on Threshold and Anomalies
In Zoho Analytics, users can set up alerts based on thresholds and anomalies to proactively monitor key business metrics and detect potential issues promptly. Threshold alerts allow users to define specific numerical thresholds for metrics such as sales revenue, inventory levels, or customer satisfaction scores. When a metric crosses or falls below the predefined threshold, Zoho Analytics triggers an alert, notifying relevant stakeholders in real-time.
Additionally, anomaly detection alerts enable organisations to identify unusual patterns or outliers in their data. Leveraging advanced machine learning algorithms and statistical models, Zoho Analytics automatically detects anomalies that deviate significantly from expected patterns. These alerts serve as early indicators of potential issues or opportunities, allowing businesses to take timely corrective actions or capitalise on emerging trends.
Business benefits of employing Alerts Based on Threshold and Anomalies
By configuring alerts based on thresholds and anomalies, businesses can ensure proactive monitoring of critical metrics, mitigate risks, optimise operations, and seize opportunities for growth. This capability enhances decision-making agility and empowers organisations to stay ahead in today’s dynamic business environment.
Ask Zia Bot in Microsoft Teams
The integration of Ask Zia Bot with Microsoft Teams in Zoho Analytics enables seamless access to advanced data analysis and reporting capabilities directly within the Teams environment. Users can leverage the powerful AI-driven features of Ask Zia Bot to ask complex data queries, generate reports, and gain actionable insights without leaving the Teams interface.
With Ask Zia Bot in Microsoft Teams, teams can:
- Access Data Insights: Obtain quick answers to data queries, access key business metrics, and uncover trends effortlessly.
- Generate Reports: Create and share interactive reports and dashboards directly within Teams, facilitating collaborative decision-making.
- Predictive Analytics: Leverage predictive analytics capabilities to forecast trends and outcomes, enabling proactive decision-making.
- Customization and Automation: Customise data visualisations, automate report generation, and receive scheduled updates, enhancing productivity and efficiency.
By integrating Ask Zia Bot into Microsoft Teams, Zoho Analytics enhances collaboration, accelerates data-driven decision-making, and empowers teams to harness the full potential of their data seamlessly within their preferred collaboration platform.
4. Build Your ML Models with AutoML & Code Studio
With AutoML, create custom machine learning models without coding, facilitating advanced predictive analytics tailored to your business requirements. Code Studio offers Python-based customisation for data preparation, transformation, and complex analytical modeling, empowering data scientists and analysts to derive deeper insights effortlessly.
AutoML (Zoho Analytics Enterprise Plan)
AutoML in Zoho Analytics’ Enterprise Plan empowers users with automated machine learning capabilities, offering a code-free environment that simplifies the process of training, verifying, and deploying custom machine learning models. This functionality is designed to be accessible to users with varying levels of data expertise, enabling them to leverage advanced analytics without needing extensive programming skills.
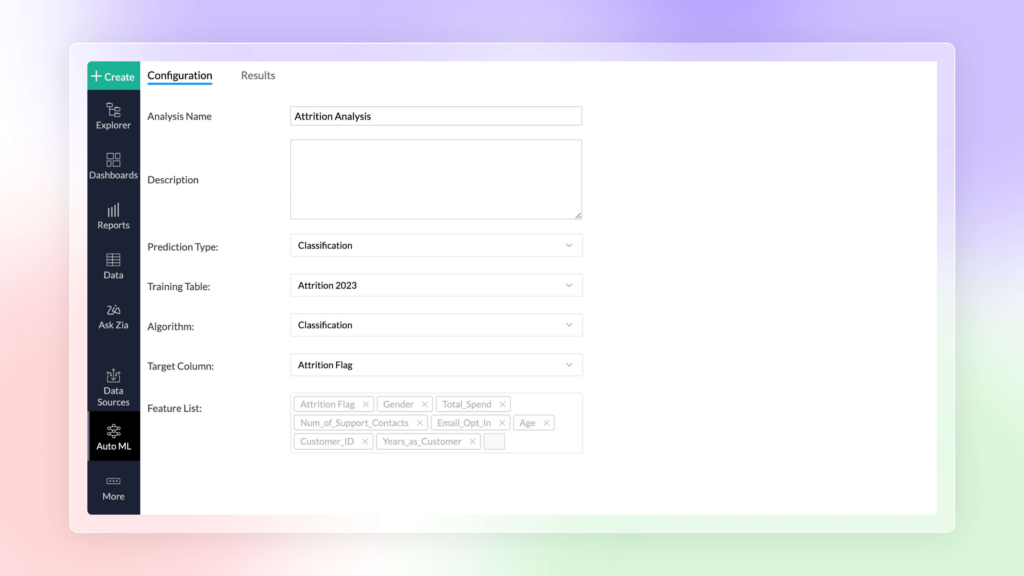
Key features and benefits of AutoML include:
- Code-Free Experience: Users can build machine learning models without writing complex code, making it accessible to business analysts, data scientists, and other professionals.
- Efficiency and Speed: AutoML streamlines the model development process, automating tasks such as feature engineering, model selection, and hyperparameter tuning. This results in faster model deployment and time-to-insight.
- User-Friendly Interface: The intuitive design of AutoML ensures a seamless user experience, with guided workflows and interactive tools that facilitate model creation and validation.
- Customization: Tailor ML models to specific business needs by selecting appropriate algorithms, adjusting parameters, and validating performance metrics within the platform.
- Scalability: Handle large datasets and complex analytical tasks efficiently, enhancing scalability and supporting robust data-driven decision-making.
By integrating AutoML into Zoho Analytics’ Enterprise Plan, organizations can harness the power of machine learning to derive actionable insights, improve forecasting accuracy, and optimize business processes, all while maintaining ease of use and flexibility.
Code Studio (Zoho Analytics Enterprise Plan)
Code Studio in Zoho Analytics’ Enterprise Plan introduces Python-based capabilities that empower users to develop and import custom logic and machine learning (ML) models tailored to their unique data requirements. This feature enhances the platform’s flexibility and enables advanced data preparation, transformation, enrichment, and analytical modeling directly within the analytics environment.
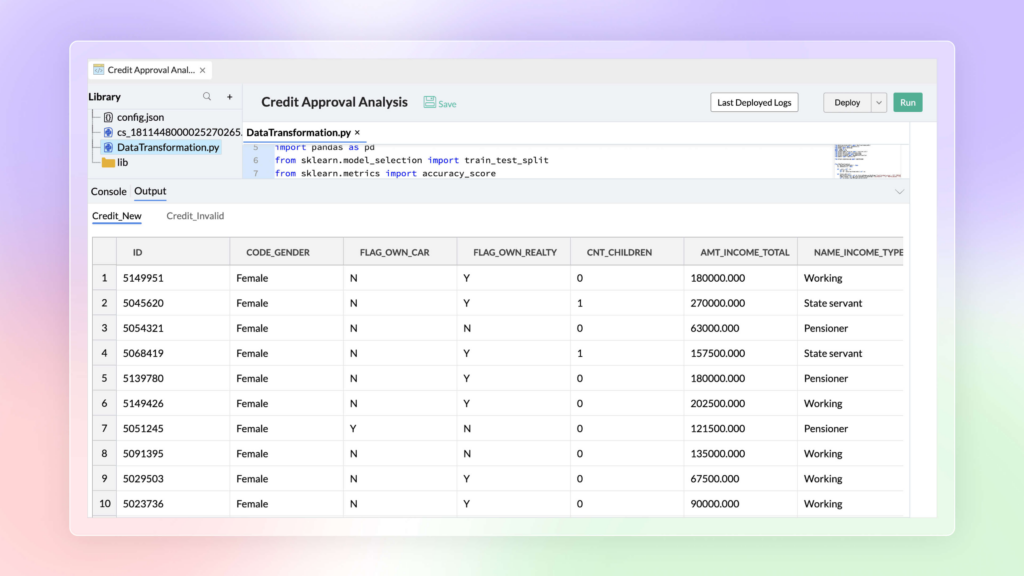
Key features and benefits of Code Studio include:
- Custom Logic Development: Users can write and execute Python scripts to perform complex data manipulations, calculations, and transformations. This flexibility allows for customised data processing workflows that are specific to organisational needs.
- Machine Learning Model Integration: Integrate custom ML models developed in Python directly into Zoho Analytics. This capability supports predictive analytics, anomaly detection, classification, and other advanced analytical tasks.
- Data Enrichment and Transformation: Leverage Python’s extensive libraries and frameworks to enrich data with external sources, perform feature engineering, handle missing data, and apply sophisticated transformations.
- Interactive Development Environment: Benefit from an interactive coding environment within Zoho Analytics, facilitating real-time testing, debugging, and iterative refinement of Python scripts and ML models.
- Integration with Existing Workflows: Seamlessly incorporate Python-based scripts and models into existing analytical workflows and reports within Zoho Analytics, ensuring consistency and accuracy in data-driven decision-making processes.
- Enhanced Data Insight: Gain deeper insights and uncover hidden patterns in data through advanced analytics techniques powered by Python, enhancing the overall effectiveness of business intelligence and analytics initiatives.
Code Studio in Zoho Analytics’ Enterprise Plan empowers data analysts, data scientists, and developers to harness the full potential of Python programming for sophisticated data handling and advanced analytical modeling, fostering innovation and driving business growth.
Data Storytelling
Enhance collaboration and decision-making with BI Fabric, allowing you to create unified BI portals across various analytics platforms. Visual Zia Insights now supports visual narratives, making data interpretation more intuitive and impactful. Export multiple views as PowerPoint presentations for comprehensive reporting and stakeholder presentations.
BI Fabric in Zoho Analytics 6.0
BI Fabric in Zoho Analytics enables organisations to create unified business intelligence (BI) portals that cater to diverse business needs. This feature facilitates the aggregation of reports not only from Zoho Analytics but also from other leading BI applications such as Tableau and Power BI. By consolidating data insights and analytics dashboards into a single portal, BI Fabric enhances collaboration, promotes centralised accessibility, and empowers C-level executives to make informed and timely business decisions.
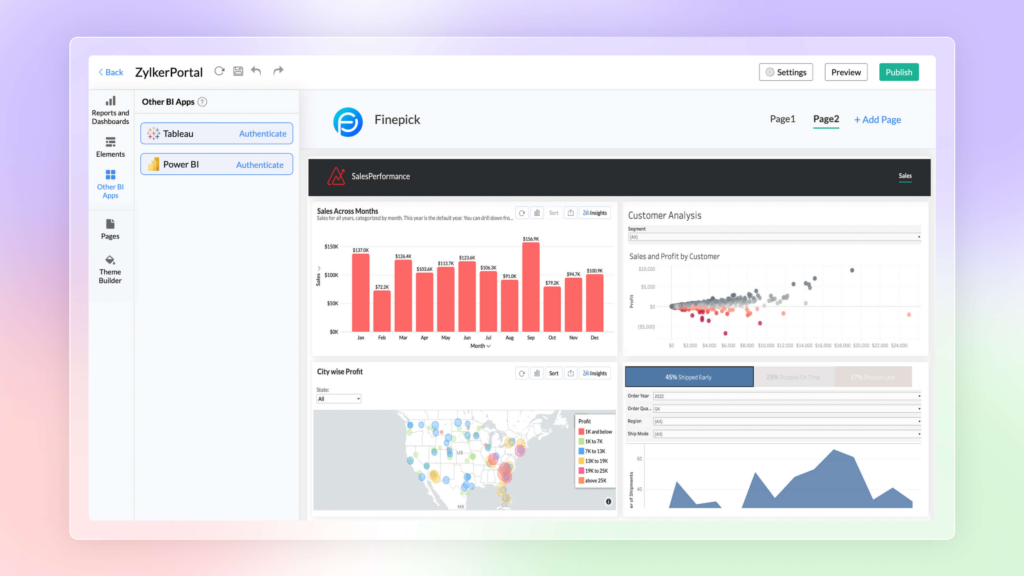
Key features and benefits of BI Fabric include:
- Unified BI Portals: Integrate reports and dashboards from multiple BI tools, including Zoho Analytics, Tableau, and Power BI, into a single, cohesive portal. This unified view eliminates the need for users to switch between different platforms, streamlining access to critical business insights.
- Enhanced Collaboration: Facilitate seamless collaboration across departments and teams by providing a centralised location for accessing and sharing BI reports. Team members can collaborate more effectively on data-driven projects and initiatives, fostering a culture of data-driven decision-making.
- Centralized Accessibility: Ensure that stakeholders across the organisation, from executives to frontline employees, have easy access to relevant data and analytics. BI Fabric promotes self-service analytics by making comprehensive business intelligence resources readily available to authorised users.
- Improved Decision-Making: Empower C-level executives and decision-makers with consolidated, up-to-date insights from various data sources. By presenting a holistic view of organisational performance and trends, BI Fabric enables executives to identify opportunities, mitigate risks, and align strategic initiatives with business objectives.
- Scalability and Flexibility: Scale BI initiatives seamlessly as organisational needs evolve. BI Fabric supports integration with a wide range of BI tools and data sources, ensuring flexibility in adapting to changing business requirements and technological landscapes.
- Customizable and User-Friendly Interface: Customise the BI portal’s interface to align with organisational branding and user preferences. The intuitive design of BI Fabric enhances user adoption and engagement, empowering users to navigate and utilise BI resources effectively.
BI Fabric in Zoho Analytics represents a powerful solution for organisations seeking to consolidate and maximise the value of their BI investments. By integrating disparate BI tools and streamlining data access and collaboration, BI Fabric supports informed decision-making and drives business growth through actionable insights.
Visual Zia Insights
Visual Zia Insights in Zoho Analytics now delivers visual narratives, enhancing data comprehension with impactful visuals. These graphics enable efficient processing of complex information through multi-dimensional interpretations such as comparison, contribution, distribution, trends, and proportions.
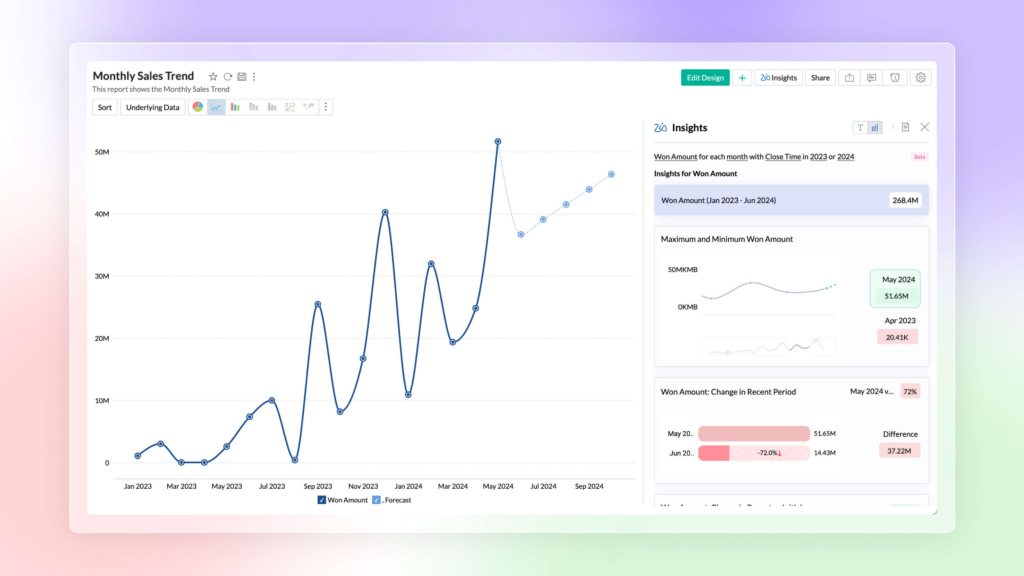
Business benefits of Visual Zia Insights
This capability not only accelerates decision-making but also improves communication across teams, fostering a deeper understanding of data insights and facilitating informed business strategies.
Zia Insights -Multilingual Support
Zia Insights in Zoho Analytics now offers multilingual support, including French and Spanish. Users can seamlessly switch between languages based on their preferences when accessing insights for specific reports.
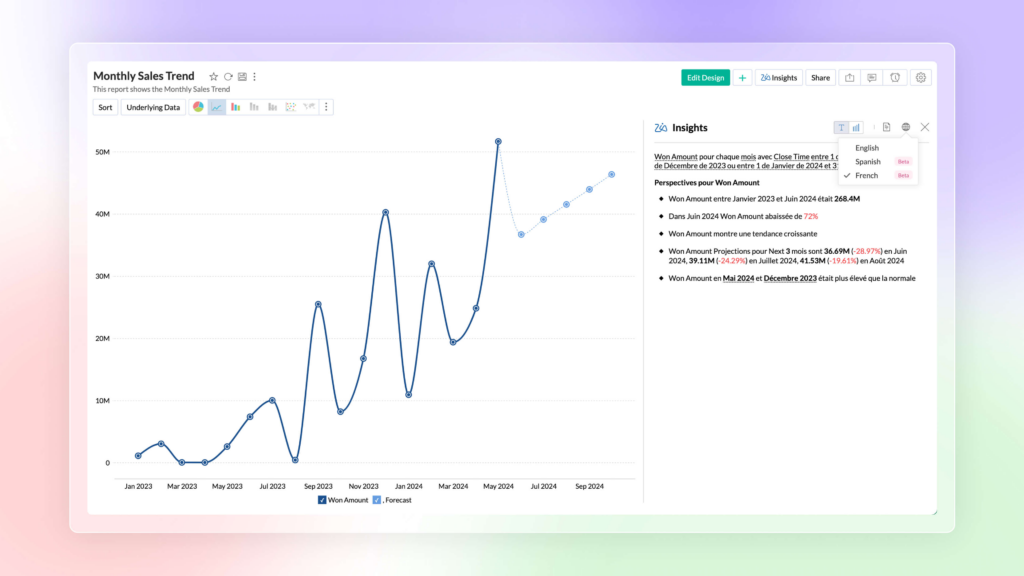
Business benefits of Zia Insights -Multilingual Support
This feature enhances accessibility and usability for international teams. This ensures that users can engage with data analysis and reporting in their preferred language, thereby promoting clearer communication and facilitating more effective decision-making processes across diverse linguistic backgrounds.
Export as PPT
You can now export multiple views from Zoho Analytics directly into a Microsoft PowerPoint presentation format. This feature allows you to compile and present your data insights in a visually compelling manner. These styles are suitable for meetings, presentations, or reports. Additionally, you can enhance the security of your exported presentations by protecting them with a password. As a result ensuring that sensitive information remains confidential and accessible only to authorised personnel.
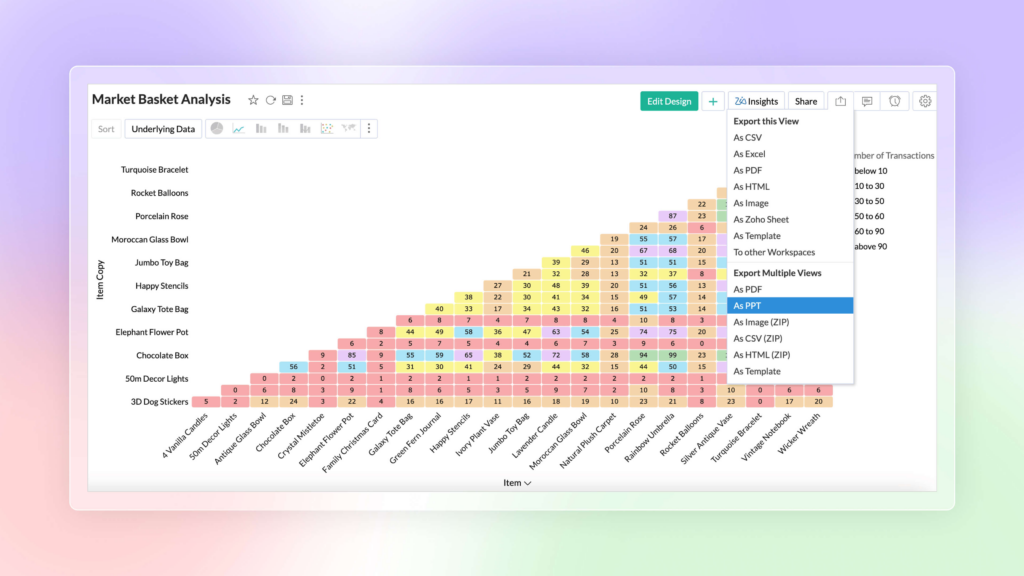
Business benefits of Export as PPT function
This capability streamlines the process of sharing analytical findings across your organization while maintaining robust data security protocols.
More Enhancements
Refine analysis with Top or Bottom (within) Filters, support for Date and String data types in Aggregate Formulas, and a Global User Filter in Dashboards for seamless data exploration. The enhanced user interface now supports right-to-left languages for improved accessibility.
Top or Bottom (within) Filters
With the new “Top or Bottom (within) Filters” feature in Zoho Analytics, you can effortlessly identify and analyse top and bottom performers across various dimensions of your data. This functionality enables you to apply rank-based filters to quickly pinpoint the highest or lowest performers within specific groups or categories, all without the need for writing complex formulas.
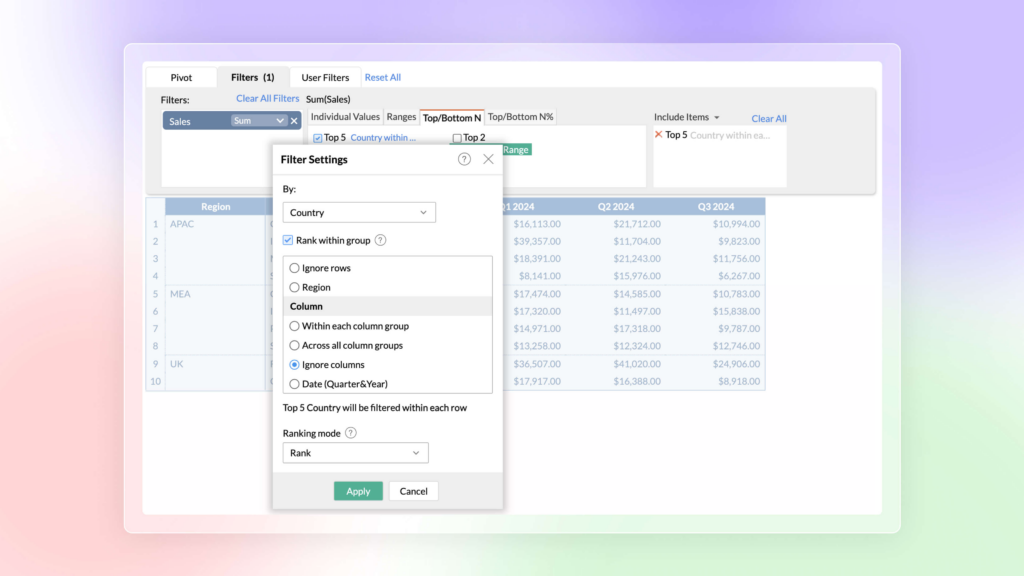
Business benefits of Top or Bottom (within) Filters
Whether you’re evaluating sales figures, customer satisfaction scores, or any other metric, this capability empowers you to gain actionable insights and make informed decisions more efficiently. It simplifies the process of performance analysis, allowing you to focus on strategic actions that drive business growth and efficiency.
Date and String data types in Aggregate Formula
Zoho Analytics now offers support for date and string data types as return types in aggregate functions, marking a significant enhancement for data analysis tasks. This improvement allows users to perform more sophisticated calculations and analyses, particularly in scenarios like cohort analysis, project milestone tracking, and other diverse use cases where these data types are crucial.
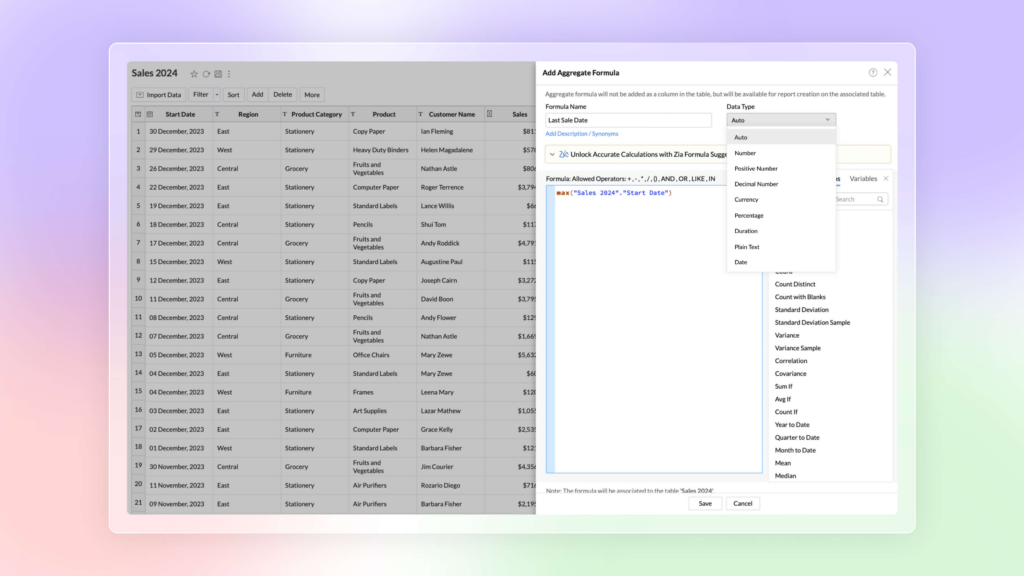
Business benefits of Date and String data types in Aggregate Formula
With this capability, you can aggregate and summarise date-related metrics and textual information more effectively within your reports and dashboards. This ensures greater flexibility and accuracy in deriving insights from your data, thereby enhancing your overall analytical capabilities and decision-making processes.
Global User Filter in Dashboards
With the introduction of the Global User Filter in Zoho Analytics dashboards, users can now implement a unified user filter that spans across all tabs within a dashboard. This feature allows for consistent filtering of data across various reports and visualisations within the dashboard interface.
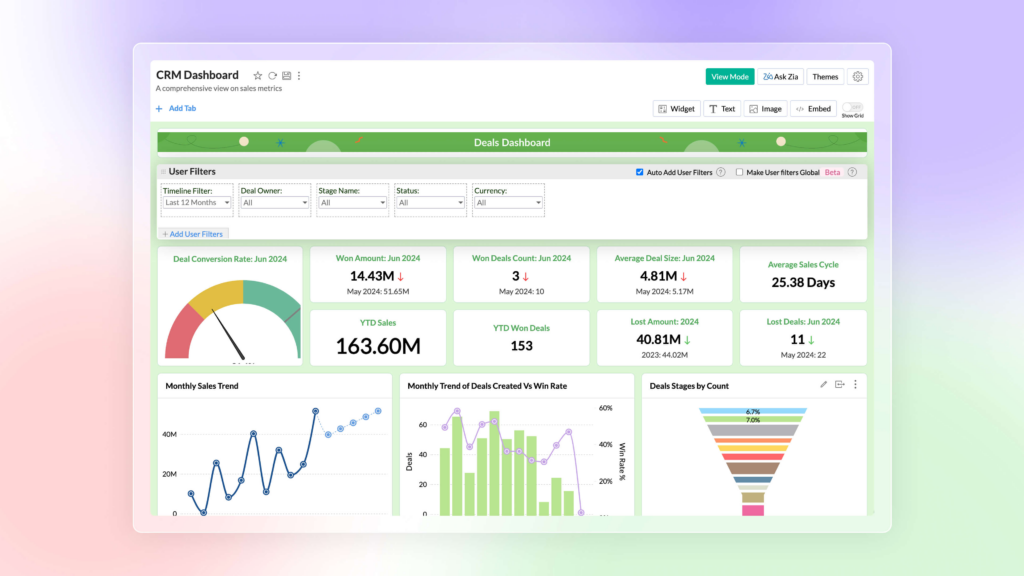
Business benefits of using Global Filter in Dashboards
By applying a global user filter, administrators and users can streamline data exploration and analysis. This ensures the selected filter criteria are uniformly applied throughout the entire dashboard. This capability enhances usability by reducing the need to set filters individually across multiple tabs. As a result saving time and promoting a more cohesive analytical experience.
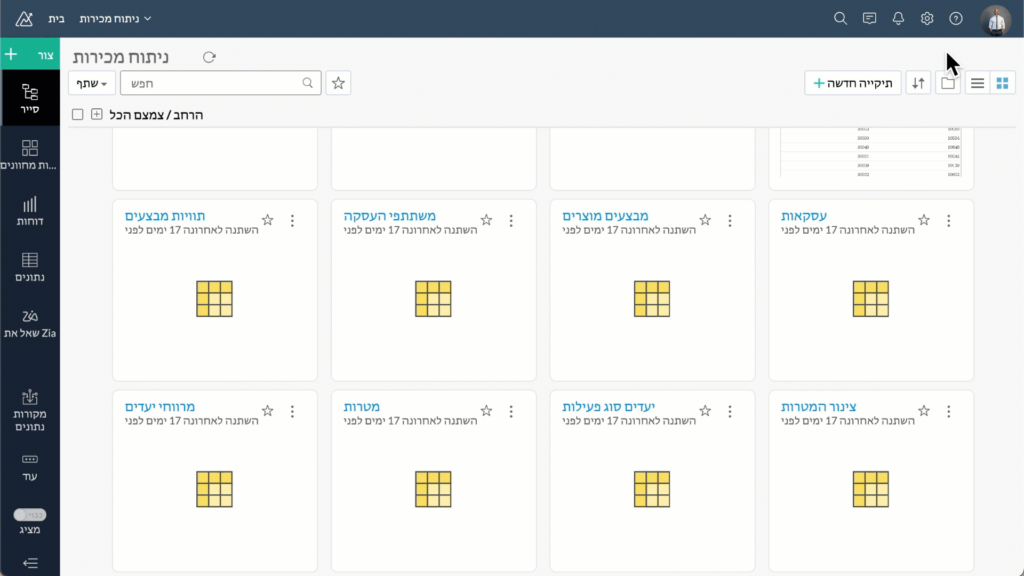
Enhanced User Interface
Zoho Analytics now supports a right to left user interface. This option is best suited for languages like Arabic, Hebrew, and Persian that are read from right to left.
Security Enhancements
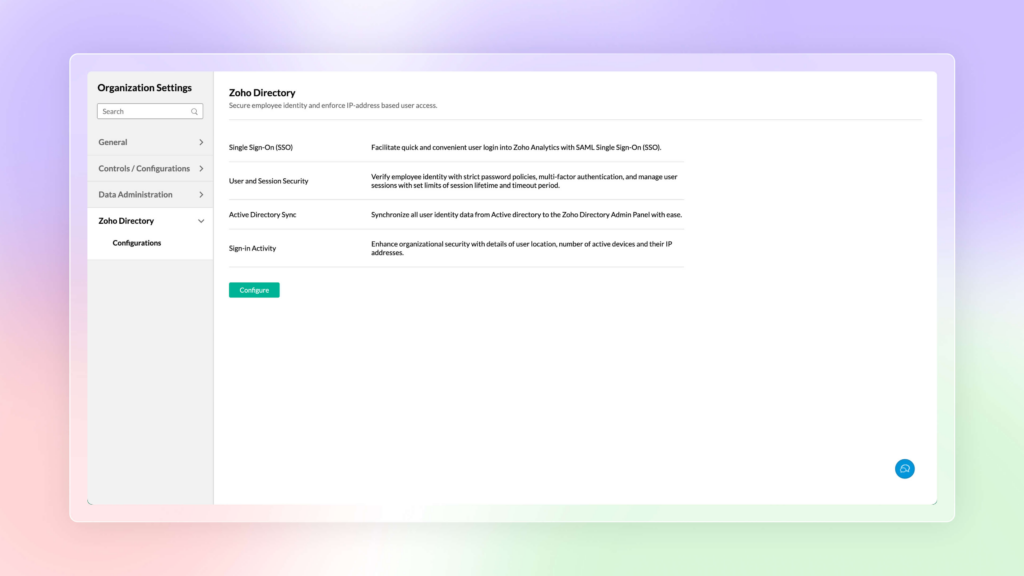
Zoho Analytics prioritises data privacy with enhancements such as Zoho Directory integration for streamlined user access management and workspace-level IP restrictions for enhanced security against unauthorised access.
Zoho Directory
The Zoho Analytics’ integration with Zoho Directory allows administrators to handle identity and user access management with ease. You can now easily setup Single Sign-on, setup Active Directory sync, manage user access, etc., easily with Zoho Directory.
Workspace Level IP Restriction
Configure workspace-level IP restrictions for enhanced security and to prevent unauthorized access. Previously, IP restrictions were available only at the account level.
Features in Private Beta
ChatGPT in Ask Zia
Ask Zia now integrates with ChatGPT assisting you to write complex queries and formulas for effective data analysis.
Diagnostic Analysis
Zia insights now supports diagnostic analysis helping you understand the root causes for a certain outcome.
Custom Connector
Zoho Analytics now enables you create your own integration with third party applications. Please refer to this post to learn more.
Experience the Future of Data Analytics
As you explore the groundbreaking features of Zoho Analytics 6.0 Beta, consider how they can revolutionise your data analysis and reporting capabilities. Whether you’re a business user seeking insightful visualisations or a data scientist building custom ML models, these enhancements are tailored to meet your unique analytical needs.
Stay tuned for the general availability release to experience the full potential of Zoho Analytics 6.0 across all plans including Zoho One. In the meantime why not Book a meeting with us to discuss how you can leverage these enhancements to drive better insights and decision-making in your business. We look forward to helping you unlock the full potential of Zoho Analytics 6.0 for your organisation.